Quantifying how likely each birthday is present (covered) in some large group of people.
Table of Contents
1 Introduction
I recently got nerd sniped by a fascinating post on Hacker News titled Every day is an Owl’s Birthday! by SeniorMars. It explored the problem of estimating if there was at least one student at a university for every birthday. Put another way, it explored the following question:
Given $n$ people, what is the probability that all $N$ birthdays are covered? That is, given $n$ people, what is the probability that there is at least 1 person for each birthday?
As well as the related question:
What is the expected number of people required to have at least 1 person for each birthday? That is, how many people do you need to approach and ask what their birthday is before you see all birthdays?
For the latter, the minimum number of people is obviously $n=N=365$. However you would have to be very lucky to get this outcome. On the other extreme, one can imagine an incredibly unlucky case where 1000 people are approached and all are born on May 5th, and hence you would be no closer to your goal than when you started. You might end up approaching hundreds of thousands of people. But between these two extremes, how many people do we expect to approach on average? The first question then seeks to quantify how lucky you are with the number you get.
I want to present the results in the original post in my own way. It took me a few reads to understand those explanations, and I think I can improve on them here. However I will leave out extra material from the original including mathematic proofs, accounting for leap years and accounting for non-uniform birthday distributions.
This problem is different to the birthday paradox, which tries to determine how likely duplicate birthdays are in a group of people, and which comes up with the surprising answer that it is very likely for even a small number. I have explored this problem in an earlier blog post. The key differentiator is the birthday paradox deals with $n<N$ (less people than birthdays) where duplicates are not guaranteed, but here the problem has $n>N$ (more people than birthdays), where duplicates cause the extra complexity.
2 The Coupon Collector Problem
We will start with the second problem because it is simpler to solve. It is:
What is the expected number of people required to have at least 1 person for each birthday?
This problem is identical to the Coupon Collector’s Problem:
Given $N$ coupons, how many coupons do you expect you need to draw with replacement before having drawn each coupon at least once?
with $N=365$ birthdays.
I’ll first simulate it and present results, and then match the numbers to theory.
2.1 Simulation
To run a Monte Carlo simulation, for each trial create a vector of seen of size 365 and set it to all false.
Then get stuck in a while loop, and on each iteration generate 1 random birthday k and set seen[k] to true.
Exit when all of seen is true. Repeat this for some large number $T$ trials.
Here is an implementation in Julia:
using ProgressMeter

function coupon_collecting_simulation(ncoupons::Int, ntrials::Int)
    counts = Vector{Int}(undef, ntrials)
    @showprogress for i in eachindex(counts)
        counts[i] = run_collection_trial(ncoupons)
    end
    counts
end

function run_collection_trial(ncoupons::Int)
    seen = fill(false, ncoupons)
    coupons = 0
    while !all(seen)
        coupons += 1
        k = rand(1:ncoupons)
        seen[k] = true
    end
    coupons
end
This code can be run with coupon_collecting_simulation(365, 10_000).
Here are the results:
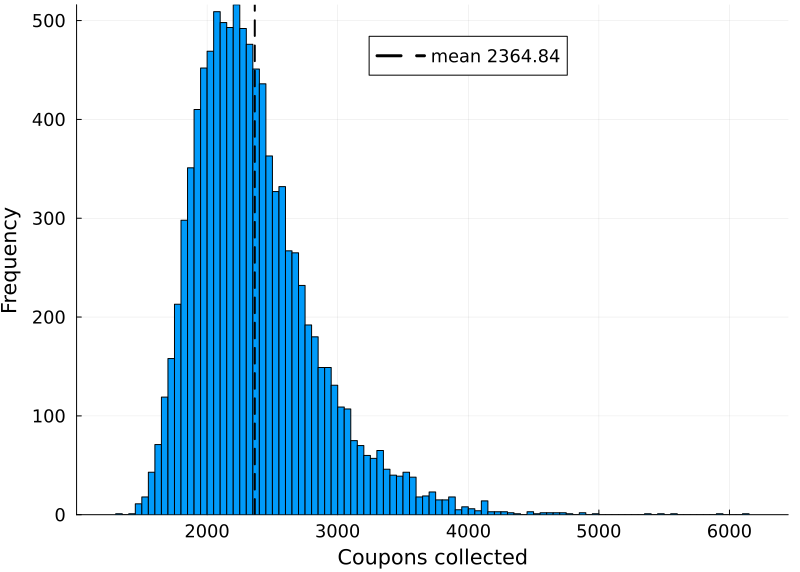
The stopping counts range from 1,349 to 5,832. The average is 2364.84 with a standard deviation of 466.68. So on average we need 6.5$\times$ as many people as the number of birthdays to see all of them.
2.2 Theory
To calculate this number theoretically, it helps to answer the following easier questions.
How many people on average do we need to ask to collect a new birthday,
- At the start?
- After collecting 50 unique birthdays?
- After collecting 265 unique birthdays?
- At the end, after collecting 364 unique birthdays?
Answers:
- One. The first person will give us our first birthday.
- There are 315 remaining birthdays and so $\frac{315}{365}=\frac{1}{1.15}=86.3\%$ of birthdays will be new. This means 1 in every 1.15 people will give us a new birthday, so we need to ask 1.15 people on average to get a new birthday.
- There are 100 remaining birthdays and so $\frac{100}{365}=\frac{1}{3.65}=27.4\%$ of birthdays will be new. This means 1 in every 3.65 people will give us a new birthday, so we need to ask 3.65 people on average to get a new birthday.
- At the end only $\frac{1}{365}$ of birthdays will be new. This means 1 in 365 people will give us a new birthday, so we need to ask a full 365 people to get a new birthday.
From this it follows that the formula for the expected number of people $n$ is the sum of all the different scenarios:
\[\begin{align} n &= \sum_{i=1}^N \frac{1}{p_i} \\ &= \sum_{i=1}^N \frac{1}{(N-i+1)/N} \\ &= N\sum_{k=1}^N \frac{1}{k} \quad ; k=N-i+1 \end{align}\]Setting $N=365$, we get 2364.64 people, which is extremely close to our simulated value of 2364.84.
The sum $\sum_k^N \frac{1}{k}$ is the harmonic number and is approximated by $\ln N + \gamma$, where $\gamma\approx 0.5772156649$ is the Euler-Mascheroni constant. This shows that this sum is unbounded for $N$. That is, the more coupons the more people that need to be asked.
3 Covering Birthdays
Now to solve the first problem. It is:
Given $n$ people, what is the probability that all $N$ birthdays are covered? That is, given $n$ people, what is the probability that there is at least 1 person for each birthday?
Based on the previous answer, we expect the probability to be very low below $n=2364$, and very high above it.
For the theory part you’ll need a good understanding of counting methods and how the binomial coefficient $n \choose k$ (read as “n choose k”) is used in combinatorics. The main calculation is with the Inclusion-Exclusion Principle formula, which I’ll introduce gently.
Because the numbers get very large very quickly, I’ll also work with the simpler case of covering 4 seasons with 5 people: spring 🌱, summer ☀️, autumn 🍂 and winter ❄️.
3.1 Simulation
For this Monte Carlo simulation more work needs to be done per data point. Take a fixed $n$ and then generate $n$ random birthdays a large number of $T$ times. Each time check if all the birthdays are covered or not and add this to a count $c$. (The simplest way to do this is check if the length of the hashed set is 365.) After all the trials estimate the probability as $c/T$. Then repeat this for several different $n$’s.
Here is an implementation in Julia:
using ProgressMeter

function covering_simulation(ndays::Int, ntrials::Int, population_sizes::Vector{Int})
    ratio_covered = zeros(length(population_sizes))
    for (idx, pop_size) in enumerate(population_sizes)
        covered = 0
        progress = Progress(ntrials; desc="Population size: $pop_size ")
        for i in 1:ntrials
            next!(progress)
            is_covered = covering_trial(ndays, pop_size)
            if is_covered
                covered += 1
            end
        end
        ratio_covered[idx] = covered / ntrials
    end
    ratio_covered
end

function covering_trial(ndays::Int, n::Int)
    birthdays = rand(1:ndays, n)
    length(Set(birthdays)) == ndays
end
It can be run with:
population_sizes = [365, 500, 1000, 1500, 2000, 2364, 2500, 3000, 4000, 5000]
ratio_covered = covering_simulation(365, 10_000, population_sizes)
Here are the results:
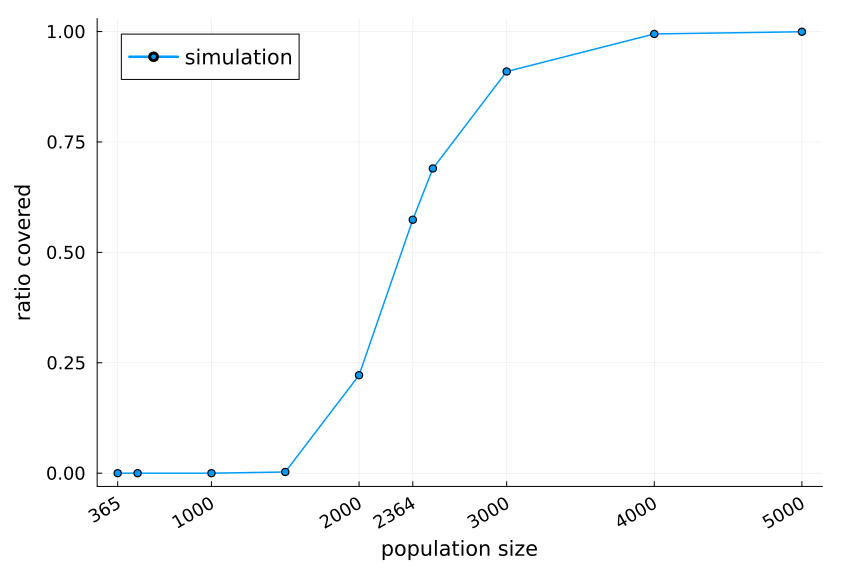
The probability is almost zero below 1500, but rises rapidly afterwards and by 4000 is almost one. At the expected value of $n=2364$, the ratio covered is 0.5739.
3.2 Theory
Counting configurations
One way to estimate the probability is to count all the different configurations of birthdays.
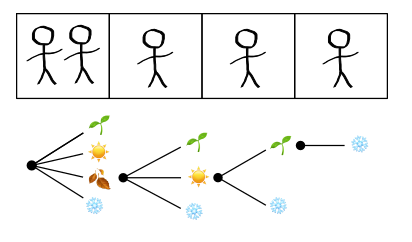
For the season problem, this is straight forward: ${5 \choose 2} = 10$ pairs can share a season, then there are 4 seasons that can be assigned to the pair, then 3 remaining seasons to the next person, then 2 to the next person, and finally the last person must take the last remaining season. This is out of $4^5$ possible configurations:
\[\begin{align} P(🌱\cup ☀️\cup 🍂 \cup ❄️ ) &= \frac{ {5 \choose 2} 4!}{4^5} \\ &= 0.234375 \end{align}\]This is just under 1/4th.
For the birthday problem, this is much more difficult. There are many, many different configurations which all need to be summed together. For example, one such configuration between $n=2364$ people is 180 birthdays each shared 6 times (1080 people), another 180 birthdays each shared 7 times (1260 people), 4 shared 5 times (20 people), and 1 shared 4 times (4 people). This is out of $365^n$ configurations:
\[\begin{align} P\left(X \right) &= \left[{2364 \choose 1080}{1284 \choose 1260}{24 \choose 20}{4 \choose 4} \right] \cdot \\ &\phantom{=} \quad \left[ {365 \choose 180 } {185 \choose 180 } {5 \choose 4 } {1 \choose 1 }\right] / 365^{2364} \\ &= \frac{2364!}{1080! 1260! 20! 4!} \frac{365!}{ (180!)^2 4! 1!} / 365^{2364} \\ &= 8.4\times 10^{-5179} \end{align}\]This probability is absolutely tiny. Worse, there are an extremely large number of configurations like this, all with extremely small probabilities. Adding them up is complex and might have numerical issues.
Thankfully, there is a simpler way.
Counting missing birthdays
All probabilities sum to 1. From this, the probability that at least one person has each birthday is 1 minus the scenarios where birthdays are missing.
As a start, assume mutual exclusivity between missing birthdays. That is, there is no overlap between missing a birthday. This is clearly false: a group of people can have multiple missing birthdays. However, it makes the calculations simple.
For the season problem, there are 4 possible ways we can exclude 1 of 4 seasons, and then there are $3^5$ possibilities for all of the five people. The probability is thus:
\[\begin{align} P(🌱\cup ☀️\cup 🍂 \cup ❄️ )&= 1 - P(\bar{🌱}\cup \bar{☀️}\cup \bar{🍂} \cup \bar{❄️} )\\ &= 1 - \frac{4 \cdot 3^5}{4^5} \\ &= 0.0508 \end{align}\]This is much smaller than the original value of 0.234. The mutual exclusivity assumption clearly does not hold here. (This will be corrected shortly.)
For the birthdays, there are 365 possible ways we can exclude 1 of 365 birthdays, and then there are $364^n$ possibilities for the birthdays for $n$ people:
\[\begin{align} P\left(\bigcup\limits_{i=1}^{365} B_i \right) &= 1 - P\left(\bigcup\limits_{i=1}^{365} \bar{B}_i \right) \\ &= 1 - \frac{365 \cdot 364^{2364} }{365^{2364} } \\ &= 0.4432 \end{align}\]This is much closer to the target value (77% of the simulated value). This is because with 2364 people it is somewhat likely that only 1 of the 365 birthdays is missing.
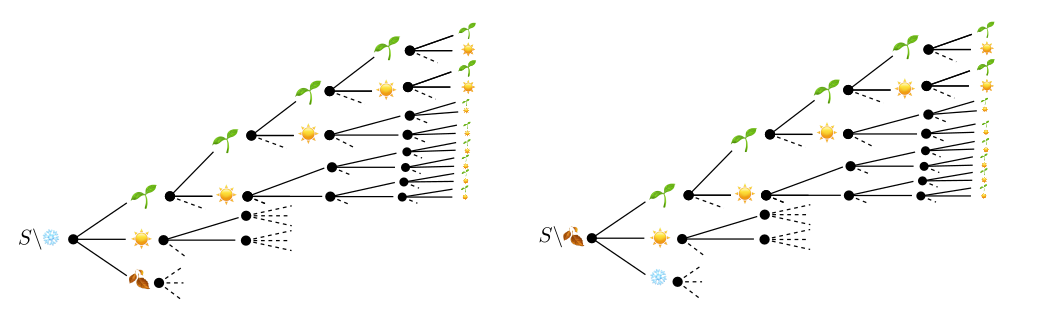
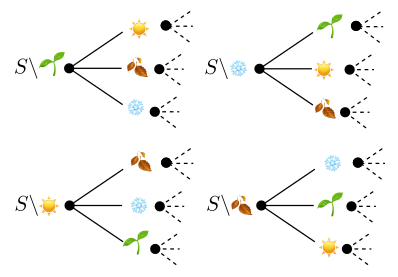
To correct these values, we need to account for overlaps in the counting trees. For the season problem, we can exclude both winter ❄️ and autumn 🍂 by only choosing spring 🌱 or summer ☀️ in either the $S\setminus ❄️$ tree or the $S\setminus 🍂$ tree. Since in both we have a choice of 2 seasons for each of the 5 people, there are $2^5=32$ overlapping branches. In total there are ${4 \choose 2} = 6$ sets of overlapping branches:
- Between $S\setminus ❄️$ and $S\setminus 🌱$.
- Between $S\setminus ❄️$ and $S\setminus ☀️$.
- Between $S\setminus ❄️$ and $S\setminus 🍂$.
- Between $S\setminus 🌱$ and $S\setminus ☀️$.
- Between $S\setminus 🌱$ and $S\setminus 🍂$.
- Between $S\setminus ☀️$ and $S\setminus 🍂$.
Each branch has been counted twice, so we need to minus one version to correct it:
\[\begin{align} P(🌱\cup ☀️\cup 🍂 \cup ❄️ )&= 1 - P(\bar{🌱}\cup \bar{☀️}\cup \bar{🍂} \cup \bar{❄️} )\\ &= 1 - \left[ \frac{4 \cdot 3^5}{4^5} - \frac{ {4 \choose 2} \cdot 2^5}{4^5}\right] \\ &= 0.23828125 \end{align}\]Much closer to our original answer of 0.234375!
Similarly, for the birthdays:
\[\begin{align} P\left(\bigcup\limits_{i=1}^{365} B_i \right) &= 1 - P\left(\bigcup\limits_{i=1}^{365} \bar{B}_i\right) \\ &= 1 - \left[ \frac{365 \cdot 364^{2364} }{365^{2364} } - \frac{ {365 \choose 2} \cdot 363^{2364} }{365^{2364} }\right]\\ &= 0.5955 \end{align}\]This is slightly over the simulated value of 0.5739.
For the next correction, it is helpful to draw a Venn diagram:
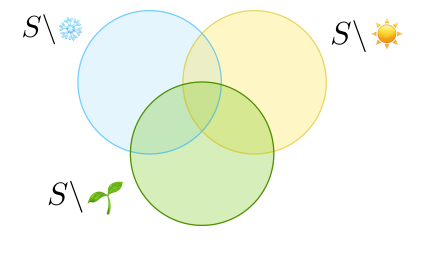
For the seasons, we initially double count the overlaps between 2 circles, but then correct this by subtracting each one once. But this means that the middle, which is initially counted 3 times, is subtracted 3 times. So we need to add it back once. There are $ {4 \choose 3 } = 4 $ overlaps we need to add back:
- Between $S\setminus ❄️$, $S\setminus 🌱$ and $S\setminus ☀️$.
- Between $S\setminus ❄️$, $S\setminus 🌱$ and $S\setminus 🍂$.
- Between $S\setminus ❄️$, $S\setminus ☀️$ and $S\setminus 🍂$.
- Between $S\setminus ☀️$, $S\setminus 🌱$ and $S\setminus 🍂$.
This is the exact same value as with counting the configurations.
For the birthdays:
\[\begin{align} P\left(\bigcup\limits_{i=1}^{365} B_i \right) &= 1 - P\left(\bigcup\limits_{i=1}^{365} \bar{B}_i \right) \\ &= 1 - \left[ \frac{365 \cdot 364^{2364} }{365^{2364} } - \frac{ {365 \choose 2} \cdot 363^{2364} }{365^{2364}} \right. \\ &\phantom{=} \left. + \frac{ {365 \choose 3} \cdot 362^{2364} }{365^{2364}} \right] \\ &= 0.5681 \end{align}\]This is now slightly under the simulated value of 0.5739.
For the seasons, we are done. For the birthdays, we can continue this pattern of over-correcting/under-correcting under the Inclusion-Exclusion Principle:
Inclusion-Exclusion Principle
$$ \begin{align} P\left( \bigcup\limits_{i=1}^{n} A_i \right) &= \sum_{i=1}^{n} |A_k| - \sum_{1\leq i <j \leq n}^{n} | A_i \cap A_j| \\ &\phantom{=} + \sum_{1\leq i <j <k \leq n}^{n} | A_i \cap A_j \cap A_k| \\ &\phantom{=} - ... \\ &\phantom{=} + (-1)^{n+1} | A_i \cap ... \cap A_n| \\ &= \sum_{k=1}^n (-1)^{k+1} \left(\sum_{1\leq i_1 < ... <i_k \leq n}^{n} | A_{i_1} \cap ... \cap A_{i_k}| \right) \\ &= \sum_{J\subseteq \{1,...,n\}} (-1)^{|J|+1} \left| \bigcap\limits_{j \in {J}} A_j \right| \end{align} \\ $$
For the birthday problem, each $A_i$ is the exclusion of one birthday (e.g. $A_5$ is January 5th missing), and groups of intersections $\sum \vert A_{i_1} \cap … \cap A_{i_k} \vert$ are calculated as the number of different combinations $365 \choose k $ of shared missing birthdays multiplied by the probability $\left(\frac{365-k}{365}\right)^n$.
The formula is then:
\[\begin{align} P\left(\bigcup\limits_{i=1}^{365} B_i\right) &= 1 - P\left(\bigcup\limits_{i=1}^{365} \bar{B}_i\right) \\ &= 1 - \frac{1}{365^n}\sum_{k=1}^{365} (-1)^{(k+1)} { 365 \choose k} (365 - k)^n \end{align}\]For $n=2364$, we get an answer of 0.5712. The simulated value of 0.5739 was close.
We can now construct a theoretical graph and compare it to the graph from the simulation:
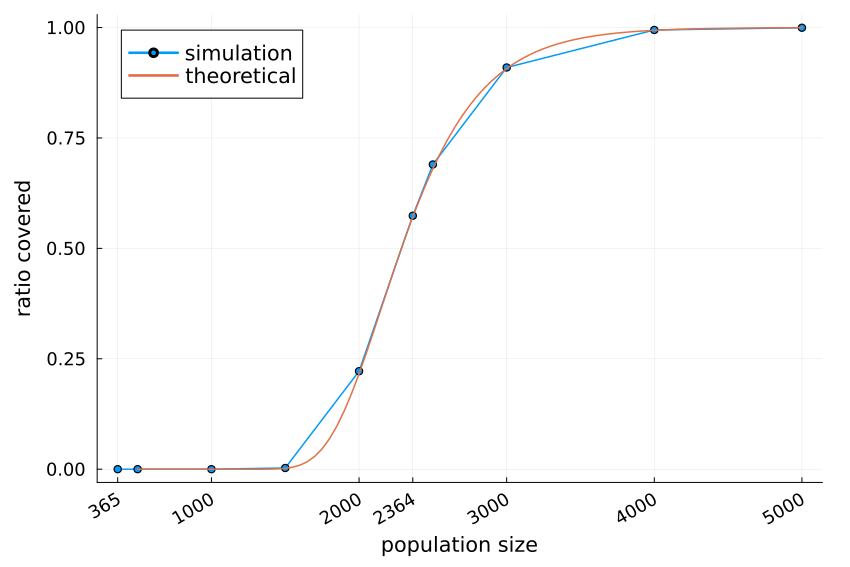
The graphs match very well.
4 Conclusion
The answer to the question, what is the probability that all birthdays ($N=365$) are present in a group of $n$ people is:
- Very low for less than 1000 people ($<3N$).
- About 50% for 2000 people ($\approx 6N$).
- Very high for 3000 people ($8N$) and almost certain for 4000 and above ($>10N$).
More generally, the Inclusion-Exclusion Principle can be used to calculate exact probabilities for this and similar problems.
This was an interesting problem, but I’m not sure if there is a practical use to it.